A few cool things about science that relate to the holidays.  I wrote this *before* Christmas, but, oh well, better late than never?

Dot Physics has a wonderful post on why Christmas tree lights stay lit even when one of them burns out, which is an unusual way for a series circuit to work.  Some nice explanations using Kirchoff’s laws make this a wonderful little post to stimulate a science lesson for the season.

From Sebastien Martin

From Sebastien Martin

I have an old post on why it’s a myth that no two snowflakes are the same shape.

And Morning Coffee Physics has a delightful little post on why snow sparkles. This is just my kind of science — gorgeously explanatory post about something we see every day.

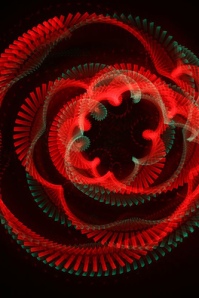
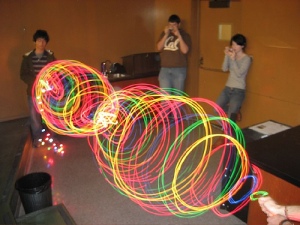
Sebastien Martin at the Exploratorium has some beautiful images on his Flickr site showing how they used Christmas lights to demonstrate resonance and harmonics (see picture at right).

Steve Spangler Science gives you some ideas to deck the halls…holiday decorations with science.

And then of course there’s the old favorite Instant Snow (video on Teacher Tube).  Insta-Snow is made from sodium polyacrylate, a water-absorbing polymer.

And on the Ellen show….

Here are some great gems from some really old posts over at Swans on Tea. Thanks to Rhett at DotPhysics for the technical assistance.

Robots doing amazing things:

Carbon dioxide is heavier than air (neat thing to try at home)

Weird psychology trick (how does he do that?)

tt_icon_170This week’s episode of my Science Teaching Tips podcast actually features, well, me! Yay. It’s nice to record myself, not always other people, though the folks at the Exploratorium are so darned clever and fun, I feel it’s my mission to document every last scrap of their wisdom and energy. I’m trying…

So, this time I give you a way to adapt a great Exploratorium exhibit to something you can do at home with a friend and a set of keys.  It’s about how we localize sound, which is something very important for people who use sound to navigate (like blind people).  So, find out more about the perception of sound by listening in to this week’s episode.  For those of you who haven’t listened before, these are just 5 minutes long!

Listen to Find that Sound.

This is the last in a series of three posts on Dan Schwartz’s work on preparation for future learning, or helping students learn skills instead of rote facts so that they can apply their knowledge to new situations. All pictures in this post are courtesy of Dan Schwartz.

Contrasting cases

In the previous post, I showed Dan’s use of contrasting cases in helping students understand density and ratios. Why is it important to show students different cases, instead of the best single example of something? Well, he said, think about perception. Consider this circle:

untitled7

We immediately recognize it as a circle. It is, after all, not a square.

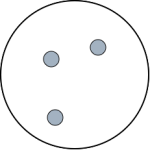
untitled9But, in fact, it is many things. It’s a empty circle. It’s a circle created with a black line. It’s a largish circle. Here are a bunch of contrasts to this circle:

untitled11 untitled10 untitled81

We’re abstracting “circle-ness” from the single example, but that’s because we recognize circle-ness already. These contrasting cases would be important if we were first learning about circles.

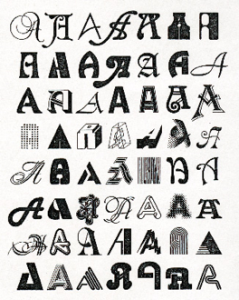
Here are some contrasting cases of something familiar to us:
untitled12

After all, what is the best way to teach Japanese speakers to say the sound “L,” which doesn’t exist in their language? Give them the purest example of an “L” sound that you can find? No, it’s to let them hear “R” and “M” and all the other sounds, so they know what the “L” is NOT in addition to what it IS.

But, this is what we do in instruction! We give students the purest example of something that we can. Consider, for example, this picture.
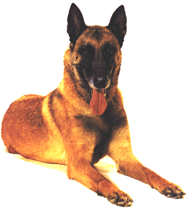
untitled13This is a perfect example of this breed. Now, tell me which one of the following is the same breed?

untitled14An expert will look at the width of the ears, the curve of the nose. But a novice can’t look at these pictures and see the immediate resemblance to the example picture. (I forget which one was the correct answer, but I think it’s the last one. The hair length is an extraneous feature, the ear shape is most important.)

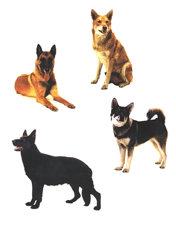
It would have helped if, first, an expert had used the following picture with contrasting cases to help you learn about ear shape (what does “rounded” ear shape look like? How wide is “wide”?). You need to be oriented to understand the key structures in what you’re seeing. You can’t just look at the picture below and learn from it, though — a bunch of different examples are confusing to a novice. The expert’s role is to help them make sense of the different cases.
untitled15An example activity

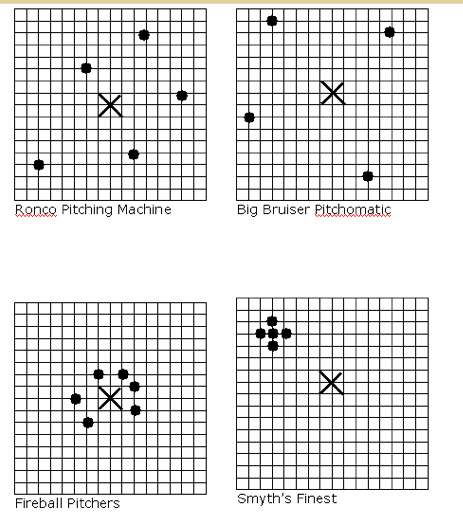
Here, for example, is his activity where he asks students to invent a reliability index for a pitching machine. He gives them several different cases so they have to find a general solution which fits all these cases. This, after all, is what we do in science – to find a general solution that fits many cases.
untitled16In my previous post, I gave his activity for teaching density using clowns in buses.

The way he uses these in the classroom is to have students explain their classmates’ solutions to each other. That means that each student’s solution has to be written clearly enough so that someone else can understand it. This act of public “publishing” of the results gives students a bit more motivation to come up with a good solution. On the other hand, the goal of this task is NOT to come up with the “right” solution! It’s to prepare students to understand the expert solution (in this case, the idea of variance) when it’s presented.

Expert blind spot

As experts in a subject, we know an amazing amount. What we’ve learned has been compressed into a bunch of huge steps. We don’t recognize the huge number of things that we’re doing when we do what seems to us to be a single step (such as computing a ratio). We need to decompile our knowledge for the novices. In order to do this, it’s good to have an intelligent novice around — someone to ask us a bunch of questions at every step so that we can see what it is that we are doing in any task. Once you’ve discovered some key, fundamental idea that is needed to solve the problem, that’s a great place to put an invention activity. Examples are density, vectors, variance, and other fundamentals.

What these activities are not:

  • Not just brainstorming
  • Not puzzlers
  • Requiring a flash of insight to solve
  • Not pure “discovery” tasks
  • Not to replace standard instruction

What these activities ARE:

  • Students make answers for one case, and recognize it doesn’t generalize to the others
  • Learning is incremental
  • Students don’t have to find the right solution to benefit from them
  • Students should start to notice the variables that matter
  • Students are told to invent a form of representation
  • They are visual
  • These activities are used strategically to communicate fundamental key ideas (like density). Not used for everything.
  • Prepares student for standard instruction

To make these cases yourself:

  • Think about your own knowledge to isolate key concepts
  • Think of each case as an experimental treatment to isolate a key variable
  • Or, think of formulas or units and make sure they contrast for each case
  • Have some sense of likely misconceptions so you can create cases that will highlight probable “traps” students might fall into
  • Make them approachable. You don’t have to be as frivolous as the clowns example, but it should be done in a context that’s different from what you want students to learn (like physics). Then you can help students map it into the new context.

What about assessment?

Dan’s main point is that our assessments need to change in order to use this kind of instruction. If we value students’ showing that their learning is adaptive, we have to give them a chance to demonstrate this on a test, to demonstrate an expert level of perception.

What do I mean by expert level of perception?

What do the images below say to you?

untitled17 untitled18

The novice answer (“car,” “bird”) is not very precise.

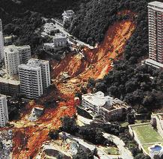
The expert answer (“2007 BMW X5” or “indigo bunting”) is much more precise, and relies on deep recognition of various features. We should test students on this more broad ability to apply their knowledge. For instance, geology students should be able to extract some important features from this picture of a landslide:
untitled19

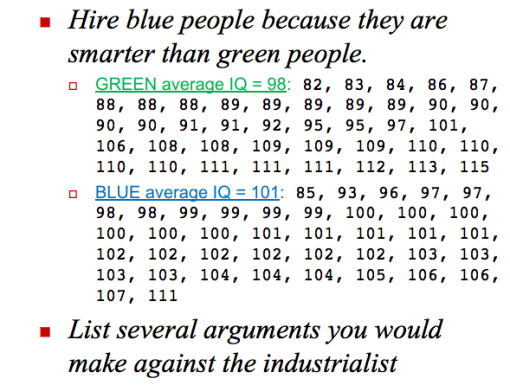
This doesn’t have to be a perceptual test — in the previous post, the “green people” vs. “blue people” example relied on students ability to recognize the variability in a data set.
untitled3

I think this stuff is incredibly powerful. Let me know of any more activities that you come up with or you know about!
A fabulous science activity from Sebastien Martin over at the Exploratorium, via teacher Bree Barnett — visualizing kinetics with LED lights. See detailed instructions and more pictures over at that blog post.

A teacher asked for a good experiment to show 8th graders that gas has mass.  “We have used balloons in the past,” she says, “but some of the kids still don’t make the connection.”

Paul Doherty replied:

I like to get a big weather balloon from a surplus store , inflate it until it is 1 meter in diameter or a little more and then a second balloon that is deflated.

Have a kid stand and throw the empty balloon at the back of their head…they feel almost no force.

Then throw the full one. It packs a noticeable punch due to the mass of moving air. the mass approaches a kilogram.

Of course you cannot weigh it using a scale due to buoyancy. You can only feel the mass by accelerating it or decelerating it.

And Eric Muller added:

Get some dry ice. It is solid Carbon Dioxide and it has noticeable mass. Lots of stores around the bay area sell dry ice. Many Safeways, Albertsons, bait shops, liquor stores, ice distributors and welding supply companies carry dry ice.

Weigh (or Mass) a chunk of dry ice. Put the chunk in a plastic bag and tie it off. It will sublimate and turn into a gas. The bag will expand noticeable. A solid, 44gram chunk of dry ice (that’s the size of a couple of fingers) will expand to around 22.4 liters of gas.

Gas has mass!

A neat observation from one of the staff physicists at the Exploratorium:

Here is a little game to play with farsighted and nearsighted glasses. Ask all your students who wear glasses to put them on and stand up. Walk up to each of them, look into their eyes and you will be able to tell them if they are nearsighted or farsighted.

If they are farsighted (and therefore have convex lenses) you will see the contour of their cheeks move OUT when viewed through their glasses. If they are nearsighted (and therefore have concave lenses) you will see the contour of their cheeks move IN when viewed through their glasses. This is a nice opportunity for a ray diagram or two! Astigmatism, graded lenses and bifocals can make this more difficult, but it is fun to try. The stronger the prescription the better. Holding far and nearsighted glasses up to colored lights or shadows also produces discriminating effects.

This could be a great “nature of science” activity! Tell them you have mystical powers and can see the shape of their retina (or some such garbage) just by looking deeply into their eyes. (Of course, it won’t work with any students who wear contacts!  Why not? Can they guess how you do it?)

TI staff educator Eric Muller explains how to make your own record player!

The first day of class is coming up — here are some nice activities you can use on the first day, or anytime you need a warm-up activity.

One teacher suggests:

Look at the Nature of Science activities at the ENSI website. There are many, many fun and interesting ones to choose from and you can use them to launch a discussion (that could continue throughout the school year) about what science is and what it isn’t. All of my students, both at the secondary level and in methods classes love to do these activities. It’s a big site with many possibilities for evolution as well.

Another teacher tells us:

A first day activity I have used for 6th and 7th grade students is to have a classroom scavenger hunt, where each student (or partners) have an outline map of the classroom and a list of items to find. As they locate each item they must label its appropriate place on the clasroom map. I put silly things such as the stuffed crocodile as well as important things such as pencil sharpener, homework assignment, etc. It is a fun activity because it gets them up and walking around to find things, as well as consulting each other for help

Another recounts:

Scene memory. I give the students a series of scenes that they will need to investigate for a moment or two. After that, the students will need to remember as many facts as they can about the scenes. This is a nice way for them to begin the scientific process and begin working in groups if you would like that.

And another has two possibilities:

“The Directions Game”
As students enter the room you hand them an index card. You can number the cards and the desks and have them sit accordingly OR you can tell them to sit where you want. Each card has a direction or statement on it. Once people are settled you explain that each person will, in turn, do or say the direction on the card. You may start by saying “Welcome to Ms. B’s Physics class.” One student’s card will say “After Ms. B. has said ‘Welcome…’ you stand, introduce yourself and say, “the pencil sharpener is there (point) in the back of the classroom.” ” There will be another student whose card indicates they will go next and on it goes. What’s nice about this is YOU don’t do ANYTHING. They say it all and remember it. It breaks the ice and is no stress for them because they have a script. The cards can have rules for the class, directions on where
things are or you can work in other things. You could also give them opportunities to share, little things like “stand up and say your favorite color.” You can make as many or as few as you want.

“Speed Lab sans supplies”
I had wanted to do that last year but was unable to as I was kicked out of my room for the first three days of school. I was put in the cafeteria on the first day with nothing. No syllabus, no supplies. I borrowed a portable whiteboard and a set of timers. I asked students to get into groups of three and somehow figure out their own personal times and group average times for four activities: walking, jogging, running, and a “funny walk.” We defined “funny walk” as anything other than walking, jogging, etc. that had to make your group mates laugh. I had no yardsticks so they had to come up with a way to do it without. They were actually really involved! Some used the length of the room as a distance, others used the tables, some used their own papers as distance units and only a few realized the tiles on the floor were a foot on each side. It worked out really well.

And one late arrival:

I went to a great workshop by John Sweeney and Antonia Corzine (St. Francis of Assisi Catholic School, Memphis, TN) at NSTA on what to do on the first day or two of school. I’m going to try it this year. He gives every student a piece of gum when they walk in the door of his classroom. Then he puts the students in groups of 3 and they blow 10 bubbles each. The student in the group that has the largest average bubble size becomes the official bubble blower, another one becomes the recorder and the last is the measurer with the calipers (ruler with paperclips attached). The task is to test two different brands of bubble gum to see which one enables the user to get the biggest bubbles. He said his room is just full of data everywhere and there is so much bliss. 🙂

The worksheets for the above activity are available here as a PDF (3.6 MB)

And one more!

How about having them draw a picture of what they think a scientist looks like. Most will draw a crazy guy in a lab coat. You could then discuss what scientists really do and explore stereotypes and assumptions, which leads to the differences between inferences and observations. I find that it really stimulates discussion and gets the kids involved.

From Pat’s Picks for STEM Educators. These “class warm-up” activities are good for anytime, not just the first day. Occasionally one finds a few minutes that need to be filled with a fun activity or an activity designed to stimulate discussion. See Pat’s original post with some great resources here.

And a first day activity about the nature of scientific inquiry — What sorts of things fall in the realm of science? First, estimate the sizes of objects, starting with a textbook, human, classroom, building, etc.  Then estimate the mass of each of these.

Plotting the graph of radius vs mass (on a log-log graph) yields a band of data points.  (Not quite a line, but the data points do hover close to each othere in a band-like manner) Observing the band one almost always asks are there things that exist outside of this band?  Science is an activity that is done with objects that we either directly or indirectly observe and then we quantify their attributes.  So the observed band is the current realm of entities that scientists can do science on.

Over the years I modified this activity to include having the students find the radius and mass of their house.   This requires making good estimations of size and also good approximations of calculations, such as knowing the foundation might be concrete and using the density of concrete with an estimated sze of the foundation, to find its weigh or mass. After plotting common objects and then some really big objects (sun, solar system, etc as well as the really small such as cells and sub atomic particles)  I spend a bit of time asking students what is the requirement for us to expand the current band?  Did other non-western cultures have the same band?- did they concentrate on observing different things?, etc.

Sorry for the long delay in posting (not that it matters — I see my stats — most of you are off reading my old posts about how water goes around drains or whether polar bear fur is fiber optic). I’ve been on vacation back in my old haunts in the SF Bay Area, and thought that I would have lots of time to post, but I was too busy enjoying myself.

While I was back, I stopped through my old alma mater — the Exploratorium — and watched Paul Doherty teaching about light. You might know the old trick of using a diffraction grating to see the rainbow. You put a diffraction grating over a bright light (an overhead projector works great) and you see white light projected on the wall. Next you block off most of the light except for a narrow slit (you can cut a manilla folder to do this). You’ll see a rainbow (blue, green, red) projected on the wall on either side of the slit. What’s going on? Light bends around the tiny slits in the diffraction grating (red bends more), making infinite numbers of overlapping rainbows, which we see as white light. The slit blocks out all the rainbows that are there except for one, so we can see a clear blue/green/red pattern. (Think about that a moment, it’s a subtle point, and important).

The tiny grooves in a CD act like a diffraction grating too, that’s why they look rainbow colored.

However, it gets really interesting. Now, take away the “slit” so we just see white light again. Put an “antislit” in front of the grating… basically, a long thin strip of paper the same size and shape as the “slit” was. Instead of letting in a narrow strip of light, we’re blocking all but a narrow strip of light.

Instead of a rainbow to either side of the antislit, we now see the *complement* of the rainbow — yellow, magenta, cyan. Why is *that*?

Think about it.

WIthout the “antislit” there, you have white light, an infinite number of overlapping rainbows.

When you put the antislit there, you have blocked a “slit” — blocking the rainbow pattern that you saw with the slit there.

So what you see is “white minus blue” which is yellow, plus “white minus green” which is magenta, and “white minus red” which is cyan.

This is similar to Bob Mlller’s wonderful light walk, in which white light outside is made of an infinite number of images of the sun. When we look at the light projected through a pinhole (even if it’s not round) we see a round image — one image of the sun. If we look at the light that goes around an anti-pinhole (like a piece of paper, even triangular) you see a round shadow… the opposite of an image of the sun!

Here is the antislit activity from Paul Doherty’s website. As he puts it, “The anti-slit removes one wavelength at a time from white light. Thus we see the spectrum of subtractive colors”